We have had thunder storms in our forecast quite frequently
lately. I thought I’d take a few minutes
to share a tool that will allow you to look into the future, just like the
forecasters, to see how intense and where lightning is likely to occur. As I have said before, I am NOT a
meteorologist, so this is written by a layman….
For the layperson..… (Keep It Brief And Simple)
I’d like to credit Scott Sistek from KOMO for providing some
resources to me to help with this blog.
There is a term meteorologists use to quantify the
probability of thunderstorms. CAPE,
which stands for Convective Available Potential Energy. This is actually a calculated metric that
determines the probability for electricity in the atmosphere. Meteorologists can look at models that
measure the vertical instability of the atmosphere to make these calculations.
Electricity in the atmosphere is caused by warm moist air on
the ground rising rapidly into cold air above.
It also needs a “trigger” like a cold front moving in from the
ocean. In simple terms, lightning is
essentially caused by “static electricity” that forms when cold and warm moist clouds
are rapidly running into each other.
This video shows how rapidly “convective cumulus” rise and fall.
So, now for the simple tool we can use to see the
probability. I just added a link on my
site called CAPE Forecast:
Here is the direct link: CAPE Forecast Link
When you click on this link, it will take you directly to a
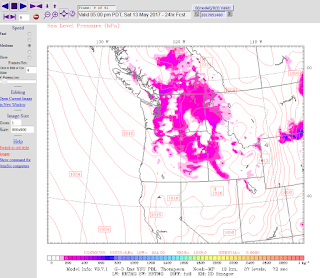
tool that graphically shows the probability of a thunder storm. It starts with essentially a time lapse in 3
hour increments showing color coded probability forecasts for lightning. It updates roughly every 12 hours at 9:00am and 9:00pm. The image below shows the CAPE for 5:00pm Saturday, May 13th.
You can see by the colors that the CAPE (joules/kilogram) is forecast to be in the 200-300 range, which is typical for us, but very mild by national standards.
When I use this tool, I usually click on the controls in the upper left had corner and stop the animation. Then I step through image by image so you can see the date and time easily.
This is a very simple tutorial on how to use the CAPE tool and some basics about how thunderstorms come to be.
Scott Sistek did a great blog last week about how our thunder storms are unique to this area. Plus, he goes into more detail that is easy to understand.
It's a good read with some nice pictures.... ;) Scott's Lightning Blog


No comments:
Post a Comment